11plus Pie Charts And Bar Charts sample papers
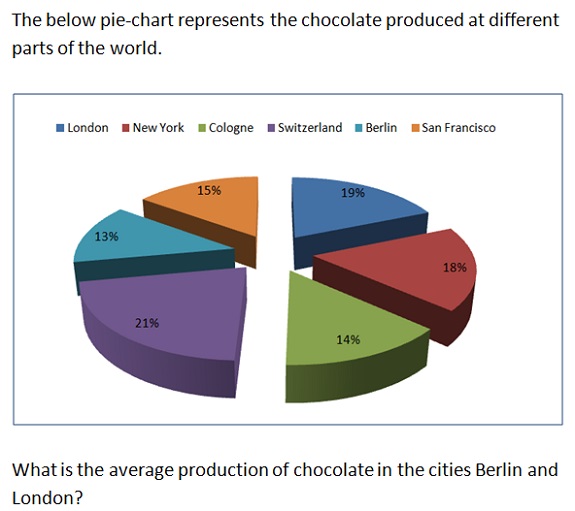
Solve this Question
|
1. 14 |
|
2. 15 |
|
3. 16 |
|
4. 17 |
Click here to see the answer
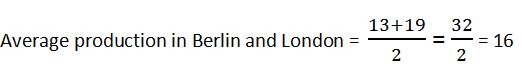
Solve this Question
The following pie chart gives the percentage of workers from various industries working in night shifts. The bar graph shows the percentage of female workers from these industries working in night shifts.
|
1. 8:7 |
|
2. 3:2 |
|
3. 17:19 |
|
4. 23:25 |
Click here to see the answer

Solve this Question
|
1. 30 |
|
2. 25 |
|
3. 35 |
|
4. 20 |
Click here to see the answer
Solve this Question
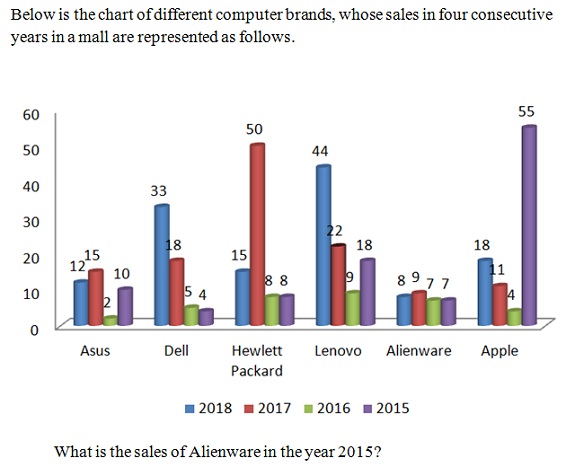
|
1. 8 |
|
2. 9 |
|
3. 7 |
|
4. 5 |
Click here to see the answer
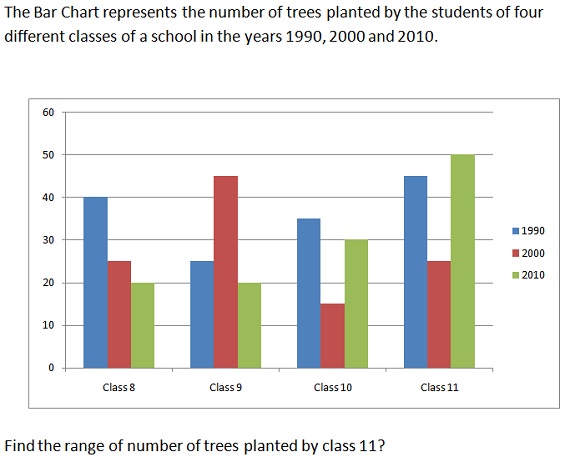
Solve this Question
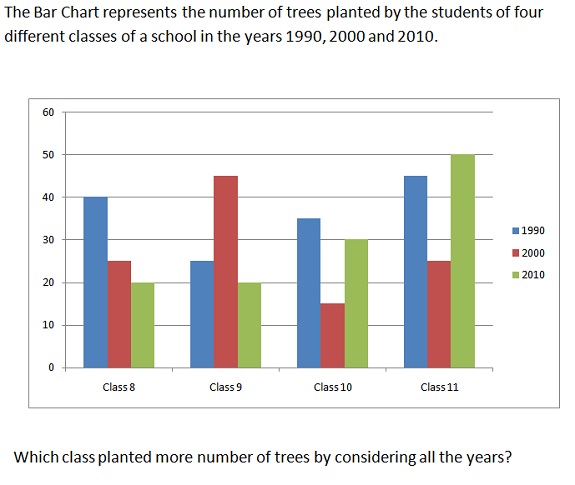
|
1. Class 8 |
|
2. Class 9 |
|
3. Class 10 |
|
4. Class 11 |
Click here to see the answer